The Metaphors, Metrics and Modeling of COVID-19

Audio By Carbonatix

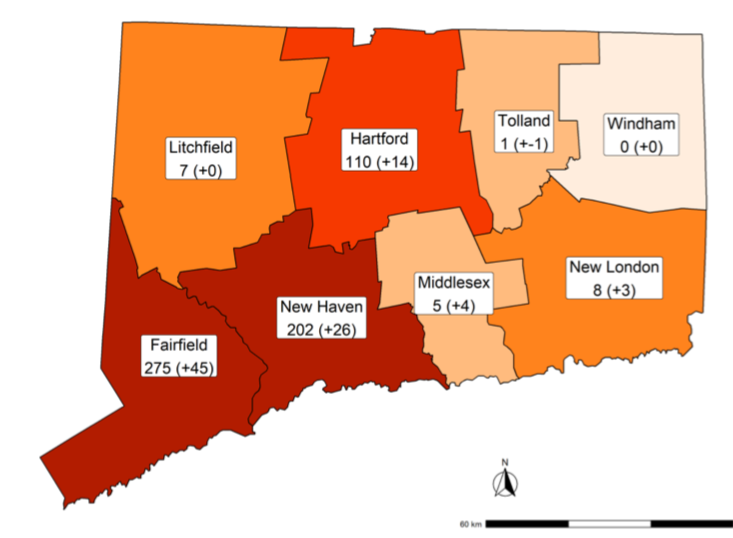
The map of COVID-19 hospitalizations by county shows a migration to the east and north, roughly following the interstate highways.
The metaphors of the COVID-19 pandemic are evolving. So are the metrics and statistical models guiding the government’s response.
By Mark Pazniokas, CTMirror.org
Public health experts speak calmly of an approaching storm, one moving west to east, like most weather in New England. Don’t forget your umbrella. The governor and hospital executives use more urgent language, warning of a surge, maybe even a tsunami. You can almost hear the distant wail of sirens.
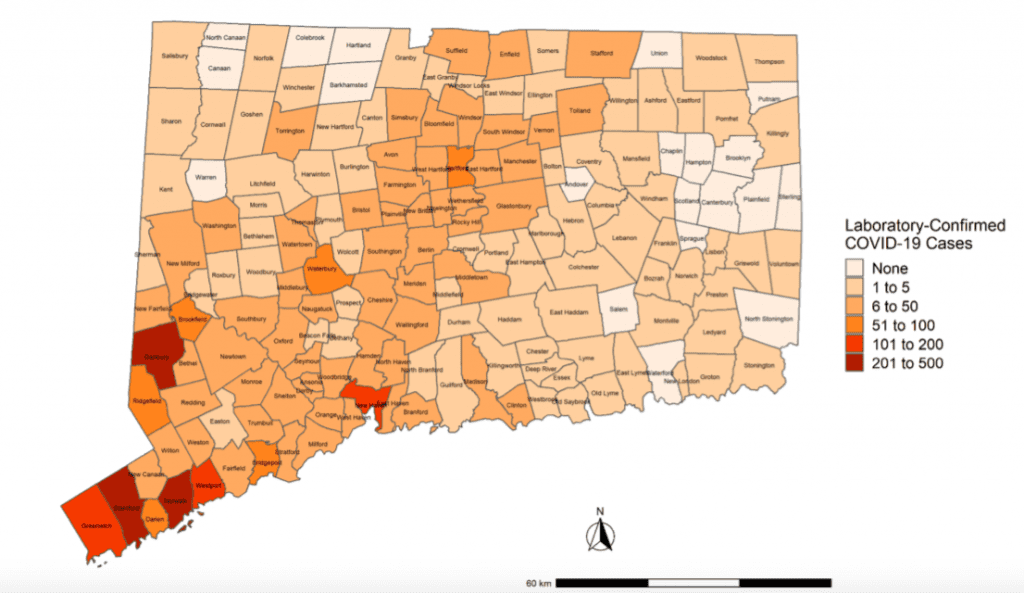
The former police chief in charge of emergency services in Connecticut uses cop vernacular. James Rovella watches the novel coronavirus creep up I-684 to I-84 to Danbury and I-95 to Stamford and Norwalk, and he thinks of his experience with two less novel plagues, drugs and guns. He says, “All they do is follow the highways.”
The metaphors of the COVID-19 pandemic continue to evolve, as do the metrics and the statistical modeling guiding the governmental response.
The White House released statistical models Tuesday showing the U.S. can expect at least 100,000 deaths from COVID-19 in coming months, even factoring in the social distancing measures imposed by governors and mayors and strongly recommended by the president. Donald J. Trump no longer speaks of a return to normalcy by Easter.
“I want every American to be prepared for the hard days that lie ahead,” Trump said.
A dynamic forecasting tool developed by the Institute for Health Metrics and Evaluation at the University of Washington suggests the current death toll of 69 in Connecticut could jump sixfold in April, then plateau in May, about two weeks behind New York and a month ahead of the U.S. as a whole. The projections fluctuate as the states update their data.

The institute sees more than a tenfold increase in U.S. deaths in April, reaching 60,000.
Even before White House disclosed details of its model, Gov. Ned Lamont said Tuesday all the algorithms and models all point to the same conclusion: April will be “a horrible month.”
Connecticut’s daily COVID-19 tally is posted on the Department of Public Health web site: The numbers of tests completed, cases confirmed, patients hospitalized, and the deaths. They are imperfect measures of what is happening on any given day and incomplete data sets feeding the forecasts of what is to come.
The DPH laboratory confirmed the state’s first two cases on March 9, none on March 10, then another on March 11.
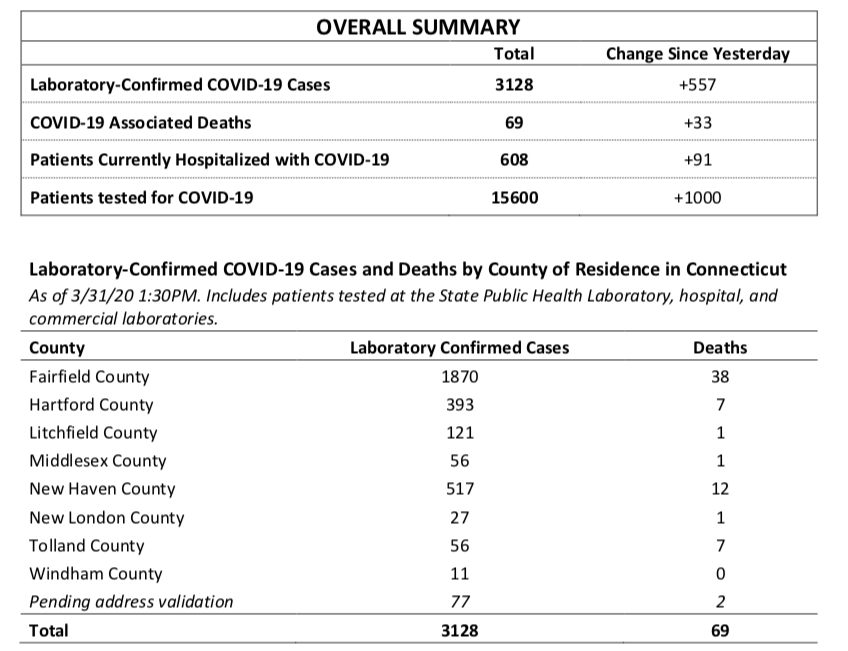
The one-day total Tuesday was 557, and the state epidemiologist says the running total of confirmed cases, now 3,128, always will be just the tip of the iceberg. What lays unseen is much larger, perhaps by a magnitude of 10, perhaps more.
“Our goal is to provide the maximum amount of data that we can,” said Av Harris, the former public-radio reporter in charge of communications at the state Department of Public Health. “It’s not a simple process.”
Connecticut publishes more details than some states, less than others. The contents of the daily update on the DPH web site was tweaked Monday and again Tuesday, offering clearer summaries and more data points. And over the weekend it shifted to hospitalization data gathered by the Connecticut Hospital Association, finding it more accurate.
“We hear from a lot of different people who are stakeholders about what data they would like to see,” Harris said. “We’re getting input from local public health departments, from legislators, from journalists, from the governor’s office.”
There has been limited data on infections in nursing homes and none among hospital workers. And there are questions about the accuracy and timeliness of the death toll, given the death Thursday of 35-year-old Mike O’Brien. It wasn’t until Monday that the DPH summary statistics reflected the death of anyone under age 40.
On Monday, the death toll was 36. On Tuesday, the Lamont administration reported an additional 33 fatalities, a misleading measure of the disease’s progress. Yes, there were a statistically significant 16 deaths in the previous 24 hours. But there also were 17 “catchup deaths,” ones that had not been previously reported by the DPH.
The DPH on Tuesday began offering some details on nursing home infections: 85 residents have been diagnosed with the disease; half have been hospitalized; and 11 have died. Thirty of the state’s 216 nursing homes have had at least one confirmed case, but the facilities have not been publicly identified since an initial outbreak in Stafford Springs.
With more private labs now conducting the tests, there is a noticeable lag in reporting some days. State law initially required private labs to only notify DPH of confirmed COVID-19 cases, not negative results. By executive order of Gov. Ned Lamont, the negatives are now reported.
As of Tuesday, there were 15,600 completed tests: 3,128 positive, about 20 percent of the total.
For the first time, the DPH put COVID-19 in a broader context on Monday, offering “syndromic surveillance” data that compares the percentage of people seeking care in hospital emergency departments for “unexplained fever/flu” symptoms this year against the past two flu seasons. It shows a dramatic spike, one indicator of the growing pressure on hospitals.
There is no fever graph showing how steeply the trajectory of confirmed cases or hospitalizations are pitching upward. But the numbers are there: hospitalizations nearly doubled overnight, from 205 on March 28 to 404 on the 29th and 517 on the 30th. On Tuesday, the number rose to 608.
“We wanted to stay two and three and four weeks ahead,” said Rovella, describing the state’s preparations to have sufficient hospital capacity. “But I can hear the footsteps.”
Hospitals in Fairfield County, the closest to New York, have the most COVID-19 patients, with 275; New Haven County has 202 and Hartford County, 110. Those statistics reflect where the patients are hospitalized, not where they are from.
An unknown numbers New Yorkers have taken shelter at second homes in Litchfield County or on the Connecticut shoreline. If they are tested positive while in Connecticut, the results will be reported and recorded in New York. There were no details on how many New Yorkers might be hospitalized in Greenwich, Stamford, Norwalk, or Danbury hospitals.
At the insistence of Lamont, the hospitals are greatly expanding capacity. Less clear is how the staffing and related supplies, particularly personal protection equipment, can expand to serve patients who soon could be in beds in mobile hospitals, universities and exhibition halls at the Connecticut Convention Center and Mohegan Sun.
DPH officials declined to comment Tuesday on the latest projections released by the White House based on the administration’s modeling.
The University of Washington forecasting tool was developed to give hospitals a sense of when to expect a surge of patients. While the death toll will not reach its apex until May, the peak demand on the hospitals is eight days away in New York and 12 in Connecticut.
The institute estimates the state’s overall hospital capacity can meet peak demand, but it will be short more than 100 intensive-care beds. It was described Monday by Wired in a deeply reported story as “a data-crunching powerhouse” with about 500 statisticians, computer scientists, and epidemiologists on staff.
Josh Geballe, the governor’s chief operating officer, said the University of Washington model is “by far, the least severe” of the ones reviewed by the state. He said modeling is an imperfect tool, given that the peak caseloads will not arrive uniformly, even in a small state like Connecticut.
“The peak is going to happen at different places at different times. Fairfield County is going to go first, the second half of April the most likely peak,” Geballe said. “It will migrate to the north and east.”
For many reasons, the true spread of a disease will remain one of educated conjecture for months.
Testing for active cases still falls short the demand, and no one is looking on a large scale yet for the antibodies that would show its reach across the state, as well as the level of community or herd immunity that might slow its spread.
A person infected by COVID-19 can have mild symptoms or be largely asymptomatic, one of the reasons why the state epidemiologist, Dr. Matthew Cartter, estimates the actual number of those infected is at least ten times larger than those with a laboratory-confirmed diagnosis.
“We’re only testing people with quite severe symptoms,” said Manon Cox, a virologist and the former chief executive of Protein Sciences, where she learned first hand the difficulty of developing a vaccine for SARS, a severe respiratory disease caused by another coronavirus. “We’re not testing the many layers behind this.”
Cox is skeptical about the likelihood of an effective COVID-19 vaccine being developed, and it ultimately might be shown to be unnecessary if the U.S. can widely test for antibodies through serology tests. Cox said antibody testing would be a boon to researchers struggling to precisely measure the spread of the disease and its mortality rate.
In the meantime, state officials say, the best they can do is prepare for scenarios outlined in the models, trying to match hospital capacity with the expected need.
“If it turns out we didn’t need it all,” Geballe said, “that’s fine.”

Stamford, Norwalk and Danbury have the most residents with laboratory-confirmed cases.
Reprinted with permission of The Connecticut Mirror. The author can be reached at [email protected].
Like what you see here? Click here to subscribe to We-Ha’s newsletter so you’ll always be in the know about what’s happening in West Hartford!


