Explore: 30 Years of Crime Trends among Municipal Departments

Audio By Carbonatix

Photo credit: Ronni Newton
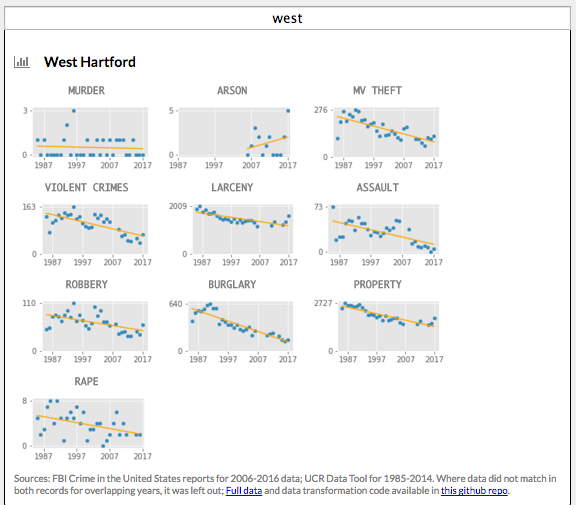
A breakdown of crime trends for police departments throughout Connecticut, including in West Hartford, prepared for the Connecticut Mirror.
By Jake Kara,
The FBI on Monday released 2017 crime data that includes municipal-level counts. We’ve combined those figures with data going back to 1985 to illustrate long-term crime trends by municipality.
Included are locales that have their own police departments — many smaller towns don’t. Instead, those towns have resident State Police troopers, and their crime data is not available on a town-by-town basis.
The crimes included in the charts below include eight serious “index” crimes as defined by the FBI: murder and non-negligent manslaughter (both included in the “murder” chart), rape, robbery, aggravated assault, burglary, larceny, motor vehicle theft, and arson. Details about the categories can be found here.
Also included are two aggregate categories: violent crime, and property crime.
Violent crime is composed of murder and non-negligent manslaughter, rape, robbery, and aggravated assault.
Property crime includes burglary, larceny, motor vehicle theft, and arson.
West Hartford’s information can be found below. To see data from the rest of the state, click here for CT Mirror’s searchable database.

CT Mirror image
Reprinted with permission of The Connecticut Mirror. The author can be reached at [email protected].


Sure – the trend over 30 years shows crime in decline. Take a look at the trend of 2007 to 2017, however, and all I’m seeing is a dramatic upward trend in categories such as larceny that are starting to approach a 20 year high.